Marcy Magiera, additional reporting by Glenn Demby and Karina Masolova
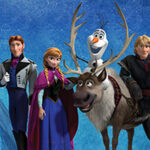
The “Frozen effect” is clearly evident on The Licensing Letter’s annual list of entertainment/character properties with more than $100 million in sales in the U.S. and Canada for 2014 (see the full list here). The property debuted on the $100 million-plus in the Top 10, amid robust growth for other platinum properties including Despicable Me/Minions, Teenage Mutant Ninja Turtles, Transformers, Avengers and My Little Pony.
TLL estimates that 42 entertainment properties reached $100 million or more in retail sales in the U.S. and Canada in 2014, as compared to 44 that made the list for 2013.
Retail sales generated by the $100 million-plus properties in the U.S. and Canada totaled $16.2 billion in 2014, up from $16.0 billion in 2013. Only two properties exceeded $1 billion in U.S./Canada retail sales for the year: classic Mickey & Friends (Disney Junior properties Mickey Mouse Clubhouse and Minnie’s Bow-Tique each have their own licensing programs and are included on the list separately) and Star Wars. Star Wars rose above the $1 billion mark and ascended to the No. 2 spot in our ranking driven by the start of the long ramp up of activity around the franchise, including the premiere of animated series “Star Wars Rebels” on Disney XD, leading into the December 2015 theatrical release of Star Wars: The Force Awakens. These two $1 billion-plus properties accounted for just 5% of the properties making the list, but 17% of estimated sales generated collectively by properties on the $100 million-plus list.
In 2013, there were three $1 billion-plus properties in the U.S. and Canada: Mickey & Friends, Disney Princess and Hello Kitty. The latter two dipped just below the $1 billion line in 2014, however, as they saw their sales chipped at in part by Disney’s newest sparkly juggernaut, Frozen.
Frozen, a movie that only opened at the box office in late 2013, cracked the $100 million-plus property list for 2014 with the flash and force of an Arctic storm, debuting at No. 6 with an estimated $820 million in domestic licensed merchandise sales. While the demand for Frozen merchandise during the 2013 holiday season was unexpected, catching Disney and retailers off guard, they managed to catch up and expand their selections to hundreds of items by year-end. During 2014, the franchise dominated store shelves and sales.
Frozen Leads MoversSince Frozen did not appear in our 2013 estimates of $100 million-plus properties, it is not assigned a percentage gain on this year’s list. Nevertheless, it was undoubtedly the fastest growing property of the 42 on the list, with retail sales growing seven-fold. While Frozen is definitely in a class by itself, it was not the only property to post rapid growth. The Despicable Me franchise, including Minions, more than doubled its retail sales in between movie releases (Despicable Me 2 in 2013 and Minions in 2015), reaching an estimated $267 million in retail sales in the U.S. and Canada last year. Five additional properties grew between 20% and 35%, adding bigger movements to the list than existed in 2013. They were Teenage Mutant Ninja Turtles (No. 5, 20%); Transformers (No. 19, 35%); My Little Pony (No. 26, 32%); Minecraft (No. 28, 33%) and Avengers (No. 29, 35%). In 2013, the fastest growing property on the list, Doc McStuffins, grew 20%. Overall, 22 (52%) of the properties listed in both 2013 and 2014 experienced growth in U.S./Canada retail sales in 2014, 16 (38%) declined and two were flat (Betty Boop and Star Trek). While both year-on-year gains and declines were mostly in the single digits-to-low double digits, there were some dramatic surges and slides. Declines of more than 20% were recorded by Monsters University (No. 11, 22%) and Angry Birds (No. 17, 46%). Just one other property cracked the list for the time in 2014: How to Train Your Dragon (No. 36, $153 million). In comparison, 12 new properties hit the list in 2013, expanding the list from from 34 properties in 2012 to 44 in 2014. Several properties that were ranked in 2013 fell off the estimated $100 million-plus list in 2014, most notably the one year wonder Duck Dynasty. Ones to WatchSeveral up and coming properties fell just short of the $100 million U.S./Canada retail sales mark in 2014 and will almost certainly make the 2015 list. The two most prominent examples are Peppa the Pig, which is over $1 billion in 2014 global retail sales but did not launch a major retail campaign in the U.S. until mid-2015, and Paw Patrol, which launched at retail in late 2013 but did not spread far enough or quite fast enough at retail to make the 2014 $100 million-plus cut-off. Bigger Impact of A-List Properties2014 appeared to be more a story about the increasing dominance of contemporary A-list properties tied to movies, blockbuster toys or both, including Frozen, Teenage Mutant Ninja Turtles, Transformers, Despicable Me/Minions, Avengers, My Little Pony and Minecraft. While there was one fewer $1 billion-plus property on the 2014 list, the number and impact of properties with $300 million to $999 million in U.S./Canada retail sales stayed roughly the same as in 2013. At the lower end of the $100 million-plus spectrum, however, properties in the $200 million to $299 million range accounted for more of the year’s business, while properties in the $100 million to $199 million range lost ground. The $200 million to $299 million segment included 29% of properties on the list, representing 17% of retail sales, compared with 18% of titles/11% of titles in 2013. The $100 million to $199 million group included just 33% of titles and 12% of retail sales, compared with 43% titles/17% sales in 2013. Once again, Disney properties dominated the $100 million-plus list, with 12 properties accounting for 29% of listed properties and 48% of dollar value of the properties on the list. Global GainsThe top entertainment/character properties in the U.S. and Canada registered an additional $22.7 billion in retail sales outside North America, for a total of $38.9 billion in estimated global sales retail sales. Sales outside the U.S. and Canada accounted for 58% of this group, the same as in 2013 and much greater than the average of 38% across all licensed properties. As we noted last year, this can be attributed to continuing growth in the performance of major franchise films outside of North America, as well as to a significant increase in the number of media outlets for children’s television in both mature and emerging markets globally. The top global performers from among the U.S./Canada $100 million club remain Mickey & Friends, Hello Kitty, Disney Princess and Winnie the Pooh. In all, 12 properties in 2014 had retail sales of licensed merchandise of $1 billion or more worldwide, up from 10 properties in this elite group last year. The top 12% of properties globally represent 29% of the titles on the list, but account for 64% of retail sales. [pieChart title=”Licensor Share of Estimated Retail Sales of Licensed Merchandise, Based on Entertainment/Character Properties, U.S. and Canada, 2014″] Definitions and MethodologyThe overall list reflects the top properties in the U.S. and Canada only and excludes top-performing global properties that have U.S. and Canadian retail sales of less than $1 million, such as Peppa. Properties included in this list are broader than those in TLL’s traditional entertainment/character segment as defined for our annual businesswide estimates. For this analysis, we have included properties that are based on a recognized character(s) and use the strategies associated with an entertainment/character licensing program, as well as the expected TV shows and films. Some properties on this list would normally be characterized as toy (Barbie, My Little Pony, Lalaloopsy), interactive (Angry Birds, Minecraft, Skylander), or publishing (Peanuts), for example. The individual property figures are sometimes at variance with publicly reported numbers in company financials or cited by company executives. We look exclusively at consumer products that are licensed to third parties for manufacture and distribution and for which the manufacturer is paying a royalty. It does not include products created through in-house divisions of the licensor rather than through licensing agreements with third parties, or “core” products made by the licensor (e.g., toys for Hasbro- or Mattel-owned properties). In addition, the numbers reflect retail sales of traditional licensed products but exclude content licensing and nonretail products such as live touring shows, theme park attractions, lotteries and slot machines, cruises and similar ventures. For those properties that are multimedia, the estimates include all merchandise for the franchise (e.g., tied to film, TV shows, etc.). LEGO cross-licensing deals (e.g., LEGO Star Wars, LEGO Batman) are included under the respective partners’ properties (e.g., “LEGO Star Wars” under Star Wars). Subbrands are included along with the master property (e.g., Clone Wars under Star Wars). If individual properties are sometimes licensed as a group (e.g., Batman as part of a multiproperty DC Comics), the estimate includes only those products tied to the individual property as specified. These estimates are developed through a combination of surveys; interviews with licensors, licensees, agents, and retailers; analysis of annual reports, royalty income and data from publicly held companies; store visits; corporate retail sales information; press releases; and news articles. All the licensors that appear on the list were given the opportunity to comment. However, all estimates are by The Licensing Letter. See the full list here. |
||||||||||||||||||||||||||||||||||||||||||||