By Karina Masolova, karina@plainlanguagemedia.com.
Retail sales of licensed merchandise based on entertainment/character properties grew to reach $31.1 billion worldwide, according to TLL’s Licensing Business Survey. In the U.S./Canada, retail sales grew 3.4% to reach $13.2 billion.
Across the board, Survey respondents reported that social media is now a dominant means of fan engagement and marketing. And particularly in entertainment/character, many are reporting that their largest retail sales gains have been from e-commerce rather than retail, where buy-ins are lower and margins are tighter.
Retail sales of licensed entertainment/character-based merchandise through e-commerce sales grew 11.1% in 2017 to reach $6.1 billion. The increase can be attributed broadly to major e-commerce platforms like Amazon, the online arms of traditional brick-and-mortar retailers, and
Online sales now make up 17.2% of all sales of licensed entertainment/character-based merchandise. Over 80% are made at brick-and-mortar locations, and 1.3% are orders made through TV shopping, mail order, and “other” distribution channels.
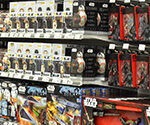
Sales via specialty outlets shrunk -10.5% in 2017 to reach $2.7 billion or 20.5% share of all sales. Although the category remains the second-largest distribution channel, in 2017 there was a steep drop in shelf space at specialty retailers like toy, gift, stationery, and book sellers. One reason was the booming popularity of collectible toys that were not based on licensed properties; another was the diminishing reliance of these shops on licensed brands to attract shoppers.
The exception to this trend were comic book and video game shops, which relied on entertainment- and video game-based merchandise to diversify their standard offerings.
Discounters saw sales rise 8.6% to reach $6.1 billion in entertainment/character-based retail sales in 2017 as retailers like Target, Walmart, and even Kohl’s stepped up to vend more entertainment-based toys, apparel, and accessories than they had the year prior.
Department stores were the only other channel to drop in share, with sales decreasing -5% from 2016 to reach just under $400 million in licensed retail sales. Faced with a tougher retail market, these stores by-and-large decided to shed licensed offerings in favor of their own branded merchandise.
| Note: Numbers may not add up exactly due to rounding. | ||||||
| (Figures in Millions) | ||||||
|---|---|---|---|---|---|---|
| Distribution Channel | Retail Sales, 2017 | Retail Sales, 2016 | Change, 2016–2017 | Share, 2017 | ||
| Discounters | $6,054 | $5,574 | 8.6% | 45.8% | ||
| Specialty stores | $2,712 | $3,030 | -10.5% | 20.5% | ||
| E-commerce | $2,273 | $2,046 | 11.1% | 17.2% | ||
| Food and drug | $868 | $831 | 4.5% | 6.6% | ||
| Variety, dollar and convenience | $764 | $742 | 3.0% | 5.8% | ||
| Department store/mid-tier | $377 | $396 | -5.0% | 2.8% | ||
| TV shopping | $104 | $102 | 1.5% | 0.8% | ||
| Mail order | $13 | $13 | 1.0% | 0.1% | ||
| Other | $52 | $51 | 1.0% | 0.4% | ||
| Total | $13,215 | $12,785 | 3.4% | 100.0% | ||
Representative Retail Stores By Distribution Channel
Mass/Discount/Club/Big Box: BJ’s, Costco, Kmart, Sam’s, Target, Walmart
Specialty Stores: Ace Hardware, Barnes & Noble, Bass Pro, Bed Bath & Beyond, Best Buy, Cabela’s, Cracker Barrel, Dick’s, Forever 21, GameStop, H&M, Home Depot, Limited, Lowe’s, Michaels, Modell’s, museum stores, PetSmart, Sherwin-Williams, Sports Authority, Staples, Zara
Department Stores & Mid-tier: Bloomingdale’s, Dillard’s, JCPenney, Kohl’s, Macy’s, Neiman-Marcus, Sears
Grocery and Drug: Ahold, Aldi, CVS Caremark, Giant Eagle, Kroger, Meijer, Publix, RiteAid, Safeway, ShopRite, Walgreen
Dollar/Value/Off-Price: Amazing Savings, Big Lots, Dollar General, Family Dollar, Ross Stores, Save Mart, Supervalu, TJ Maxx
Online/E-commerce: Amazon, Café Press, Gilt, Zappos, Zazzle
Variety and Convenience: 7-Eleven, Circle-K
TV Shopping: HSN, QVC, ShopHQ
Mail Order: Oriental Trading, Signals
Other: Kiosks, on-site, vending, etc.