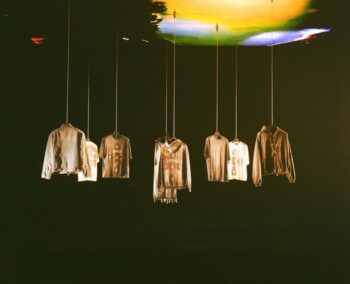
By Allison Watkinson TLL Reporter Represent has launched a licensing partnership with Guns N’ Roses to release a collaborative capsule collection inspired by the rock band. Designed for Guns N' Roses 2025 European tour, the collection combines motifs from the band's history with Represent's vintage fashion aesthetic. The full range features 7 licensed products … [Read more...] about Represent Rocks On with Guns N’ Roses Apparel
Articles
Monster High Fright Song Gets Glam Remake From Katseye
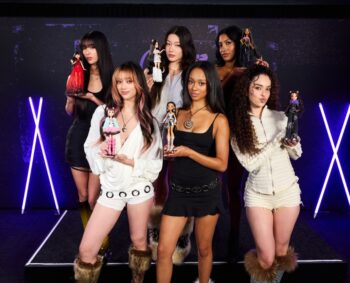
By Allison Watkinson TLL Reporter Mattel has partnered with the Katseye girl group for a musical Monster High collaboration and custom doll promotion. The Monster High collaboration offers an updated version of the brand's Fright Song anthem by Katseye, along with a licensed music video that features each member's monster personas. Katseye's new version of the … [Read more...] about Monster High Fright Song Gets Glam Remake From Katseye
Puma and Manchester City Extend Licensing Partnership
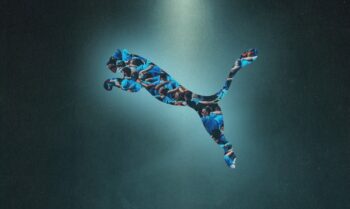
By Allison Watkinson TLL Reporter Puma has signed an extension to its licensing partnership with the Premier League's Manchester City football club. The long-term contract extension will allow Puma and Manchester City to continue developing licensed products and experiences that appeal to the club’s global community of fans. Since it first kicked off during the … [Read more...] about Puma and Manchester City Extend Licensing Partnership
Gamefam Brings KIDZ BOP Back To Car Dealership Tycoon
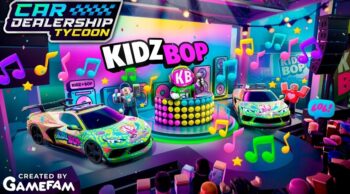
By Allison Watkinson TLL Reporter Gamefam and KIDZ BOP have announced the return of the family-friendly music brand to Gamefam’s Car Dealership Tycoon Roblox game. Designed to promote the release of the KIDZ BOP 51 album, the partnership brings several licensed integrations to the Car Dealership Tycoon game. These in-game integrations include a branded city center, … [Read more...] about Gamefam Brings KIDZ BOP Back To Car Dealership Tycoon
Bad Birdie Tees off with Taco Bell
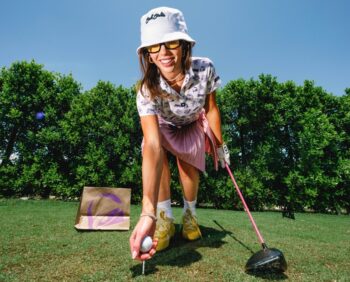
By Allison Watkinson TLL Reporter Bad Birdie and Taco Bell recently teamed up for a collaborative apparel collection and two-day junior golfing event. The co-branded collection is designed to offer fans a streetwear spin on golf apparel through a selection of pullovers, hats and accessories. Attendees of the Taco Bell x Bad Birdie Invitational tournament were offered the … [Read more...] about Bad Birdie Tees off with Taco Bell
The Licensing Awards 2025 Announces Finalists
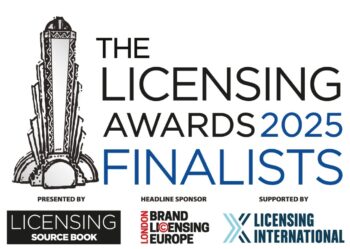
By Allison Watkinson TLL Reporter The finalists for the Licensing Awards 2025 have been announced as the count-down continues for the official award ceremony. Taking place on September 16 in The Grosvenor House Hotel in London, the event will celebrate the achievements of companies, professionals and brands from across the licensing and retail sectors. The finalists … [Read more...] about The Licensing Awards 2025 Announces Finalists
Outfit7 and Miraculous Corp Launch Year-Long Licensing Deal
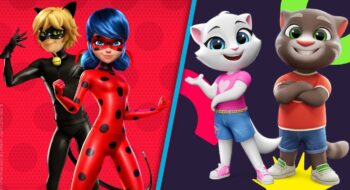
By Allison Watkinson TLL Reporter Outfit7 and Miraculous Corp have launched a year-long global collaboration between Talking Tom & Friends and Miraculous Tales of Ladybug and Cat Noir. The partnership will deliver a selection of licensed experiences across both digital and physical spaces. To kick things off, the licensing partnership is rolling out two in-game … [Read more...] about Outfit7 and Miraculous Corp Launch Year-Long Licensing Deal
Trade Show Agenda Released for Brand Licensing Europe 2025

TLL Staff Image credit: Licensing International Attendees can now get their first look at the agenda for this year's Brand Licensing Europe event. BLE is Europe’s leading event for the brand licensing industry, and takes place from October 7–9 at the Excel halls in London. It’s free to visit Brand Licensing Europe. You can simply register on the website and get access … [Read more...] about Trade Show Agenda Released for Brand Licensing Europe 2025
Brand Central: How a Licensing Powerhouse is Shaping the Future of Food, Beverage and Fan-Favorite Collabs
Brand Central: How a Licensing Powerhouse is Shaping the Future of Food, Beverage and Fan-Favorite Collabs Q&A with Ross Misher, CEO of Brand Central As the licensing landscape continues to evolve, Brand Central has remained at the forefront — particularly in the food and beverage space, where they’ve pioneered some of the most strategic yet buzz-worthy and unexpected … [Read more...] about Brand Central: How a Licensing Powerhouse is Shaping the Future of Food, Beverage and Fan-Favorite Collabs
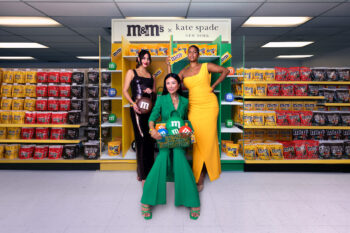
Panera and Holler and Glow Launch Cheesy Beauty Collab
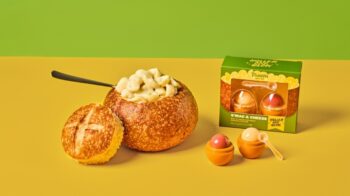
By Allison Watkinson TLL Reporter Panera Bread and the Holler and Glow beauty brand have launched a licensed lip balm duo called S'Mac and Cheese. Inspired by Panera's Mac & Cheese Bread Bowl menu item, the lip balm duo features two scents designed to smell like mac & cheese and fresh baked bread. "At Holler and Glow, we live for bold, playful beauty that doesn't … [Read more...] about Panera and Holler and Glow Launch Cheesy Beauty Collab