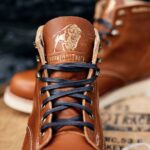
By Allison Watkinson TLL Reporter Brandgenuity has brokered an agreement between Wolverine and Buffalo Trace to launch a special-edition boot for the online retailer Huckberry. Brandgenuity is an independent licensing agency that extends brands into consumer products, services and experiences to raise brand awareness and generate revenue. On behalf of Buffalo Trace … [Read more...] about Fine Boots Put Buffalo Trace Distillery in Fine Spirits
Retailers
Update: Trademark Filings Reveal Kanye West’s Licensing Strategy
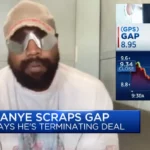
By Gary Symons TLL Editor in Chief New trademark filings by Kanye West may help reveal the music star's long-term goals, particularly after he terminated his licensing relationship with Gap Inc. According to a report from the entertainment gossip show TMZ, the rapper's company Mascotte Holdings has filed trademarks for a variety of apparel items, including jackets, hats, … [Read more...] about Update: Trademark Filings Reveal Kanye West’s Licensing Strategy
Bundaberg Partners With ToolPRO for Rum-Inspired Cabinets

By Allison Watkinson TLL Reporter Asembl has teamed up with Diageo’s Bundaberg Rum and ToolPRO on an exclusive, co-branded tool cabinet for Supercheap Auto. Asembl is a strategic and research driven brand extension agency with a focus on design, FMCG and lifestyle. The company works with global brand owners to bring new licensed products and service innovations to … [Read more...] about Bundaberg Partners With ToolPRO for Rum-Inspired Cabinets
Walmart Releases Top Toy List for Xmas 2022
By Gary Symons TLL Editor in Chief Walmart has given wannabe licensees a cheat sheet for Christmas, listing its choice for the top 55 toys for 2022. Walmart's 2022 Top Toy List is released every year to help families making decisions on their Christmas shopping, but it's also a great tool for licensees looking for their next big deal. This year's Top Toy List highlights 55 … [Read more...] about Walmart Releases Top Toy List for Xmas 2022
Macy’s Expands Store-In-Store Partnership With Toys ‘R’ Us

By Gary Symons TLL Editor in Chief Retail giant Macy's says it will expand its partnership with Toys ‘R’ Us to include all of the 500+ stores in the United States. The company previously announced the program would be rolled out into an initial 400 stores. The expansion is scheduled for completion by Oct. 15, in time for the holiday season. The deal is also a major success for … [Read more...] about Macy’s Expands Store-In-Store Partnership With Toys ‘R’ Us
Crunchyroll Acquires North America’s Largest Anime Retailer

The anime streamer Crunchyroll has completed a strategic acquisition of Right Stuf, considered the largest retailer of anime products in North America. The Sony-owned streaming service announced on Aug. 4 that it had purchased Right Stuf, just ahead of the company's annual Crunchyroll Expo event. Pricing and other terms were not disclosed publicly. The Right Stuf acquisition … [Read more...] about Crunchyroll Acquires North America’s Largest Anime Retailer
Character Licensing: Pokemon Getting a Poetic Apparel Collection

By Allison Watkinson TLL Reporter The specialist apparel licensee, Poetic Brands, has partnered with ASOS to design and manufacture a Pokemon-themed apparel collection. The collection features t-shirts, dresses, hoodies, knitwear, shorts, a denim jacket, denim short dungarees, swimwear and accessories. “We are thrilled to launch this '90s inspired cross category collection … [Read more...] about Character Licensing: Pokemon Getting a Poetic Apparel Collection
World of EPI Gains Master Toy License for LL Cool J’s Rock The Bells
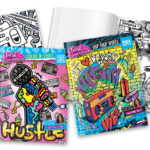
LL Cool J's hip hop venture Rock The Bells will be rockin' new merchandise at Walmart, thanks to a licensing deal with World of EPI. Founded in 2018 by LL COOL J, Rock The Bells focuses on content, experiences, and commerce that honor the timeless elements of hip hop (MCs, DJs, breakdancers, graffiti artists, etc.) that drive mainstream culture today. World of EPI … [Read more...] about World of EPI Gains Master Toy License for LL Cool J’s Rock The Bells
Jessie James and Eric Decker in Designer Shoe Warehouse Campaign

By Allison Watkinson TLL Reporter Designer Shoe Warehouse is teaming up with Jessie James Decker, Eric Decker, and their family for the brand’s 2022 Back-To-School campaign. Launching today (July 7), Designer Shoe Warehouse's Back-To-School campaign features a selection of sneakers, boots, and sandals for the whole family from various high-profile brands and designers. The … [Read more...] about Jessie James and Eric Decker in Designer Shoe Warehouse Campaign
GAP Partners on New Lines for Eyewear, Home Products

The fashion outlet Gap has announced two major new partnerships for branded eyewear and kids' home products. The eyewear deal sees Gap partnering with the global eyewear company De Rigo, launching their first collection of Gap-branded sunglasses and optical glasses. "As a champion of individuality, Gap embodies a sense of modern American optimism that celebrates what it means … [Read more...] about GAP Partners on New Lines for Eyewear, Home Products